CNA
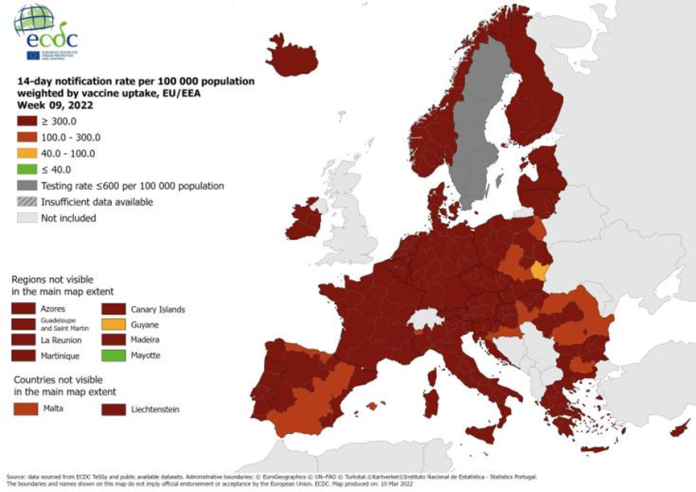
The latest epidemiological map on the spread of COVID-19 issued by the European Centre for Disease Prevention and Control (ECDC) on Thursday has shown an improvement in the situation in eastern Europe as well as in Spain.
However, most regions and countries in the EU and the European Economic Area (EEA), including Cyprus, remain in the “deep red” category, the highest available category for recording the spread of COVID-19.
The province of Subcarpathia in Poland has this week become the first region in continental Europe to pass into the “orange” category after several weeks. Regions in southern and central Poland, as well as the north-east of the country, have passed into the “red” category.
The entirety of Romania is now also in the “red” category, with the exception of certain central and western regions and the capital Bucharest, which remain in the “deep red” category.
The epidemiological situation in Spain also appears to have improved, with large swathes in the central regions of the country, as well as in the north, passing into the “red” category.
There has also been improved in central Hungary, east Croatia and the Aosta Valley region in north-western Italy, with these regions passing into the “red” category, along with Malta where the situation remains unchanged.
Improvement has been noted in the overseas French territory of French Guyana in South America (from red to orange). Meanwhile the French overseas territory of Mayotte in the Indian Ocean remains in the “green”, that is the safest, category.
Last week, Malta, along with some areas in south-eastern Poland, north-eastern Romania and central and eastern Sweden had passed from deep red to red.
The map does not include information about Sweden this week due to there being less than 600 per 100 thousand inhabitants in the last 14 days.
The map is a tool for providing updated information to local authorities and citizens on the epidemiological situation on a local level, in order to facilitate the imposition of restrictive measures and inform citizen decisions on travelling.
The ECDC map records the notification rate for COVID-19 over the past 14 days per 100 thousand people in every region of the EU/EEA countries, weighted by vaccine uptake in each region.
The ECDC map does not record the number of deaths or hospitalisations. The map also does not account for the percentage of total cases caused by the Omicron variant.
According to the ECDC’s guidelines, regions where the 14-day notification rate per 100 thousand population, weighted by vaccine uptake, is less than 40 fall into the “green” category, regions where the rate is less than 100 but 40 or more fall into the “orange” category, regions where the rate is less than 300 but 100 or more fall into the “red” category, and regions where the rate is 300 or more fall into the “dark red” category.
ECDC publishes relevant maps and data every Thursday, in support of the Council recommendation on a coordinated approach to the restriction of free movement in response to the COVID-19 pandemic. The latest revision of the Council Recommendation was adopted by EU Member States on 25 January 2022 and came into effect on 1 February 2022.
The maps are based on data reported by the Member States to the European Surveillance System (TESSy) by midnight on Tuesday.


